Audit & observability
Execution notes, correlation IDs, DAG visualization, Prometheus metrics, and structured logging
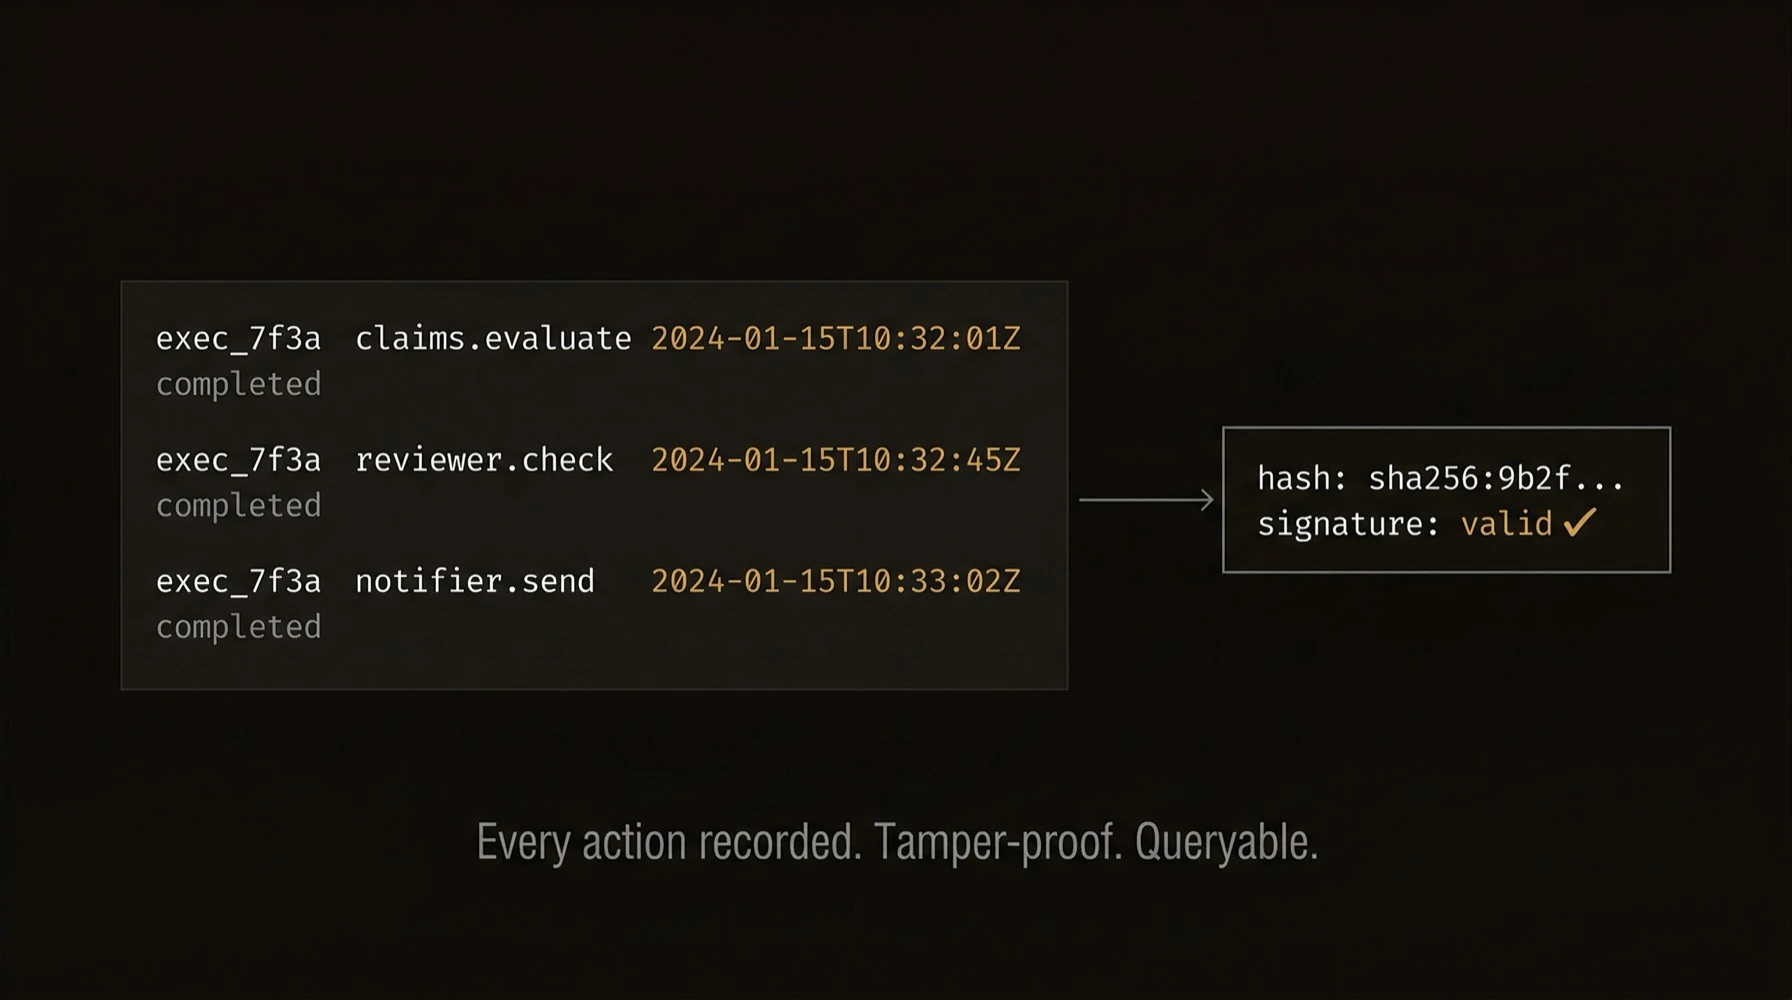
Five audit layers -- from developer notes to tamper-proof cryptographic trails -- built into every agent, every execution, every workflow.
Logs alone are not enough for agent systems. You need to know what ran, why it ran, how it branched, what it touched, and how to prove the record was not tampered with.
AgentField ships enterprise-grade observability without bolting anything on: (1) structured execution notes with tags and risk scoring, (2) correlation IDs that trace a request across every agent it touches, (3) DAG visualization of the full multi-agent call graph, (4) Prometheus metrics for queue depth, step latency, retries, and backpressure, and (5) DID-signed verifiable credentials for tamper-evident audit trails.
Minimal code can produce a much richer audit surface than ordinary application logging:
{
  "workflow_id": "wf_d4e5f6",
  "execution_id": "exec_a1b2c3",
  "target": "reviewer.review_contract",
  "notes": ["Reviewing contract #42", "HIGH RISK: score=0.91"],
  "children": [
    { "target": "policy.check_clause", "status": "completed" }
  ]
}
What just happened
The example produced more than logs: notes for human context, correlation IDs for traceability, a DAG for workflow structure, metrics for operations, and signed artifacts for proof. That is the audit story to keep visible: one execution yields multiple layers of evidence, not just one text stream.
{
  "notes": "human-readable context",
  "correlation_ids": "execution_and_workflow_scope",
  "dag": "call_graph",
  "metrics": "operational_signals",
  "credentials": "tamper_evident_proof"
}from pydantic import BaseModel
class ContractReview(BaseModel):
risk_score: float
summary: str
@app.reasoner()
async def review_contract(contract: dict, execution_context=None) -> dict:
ctx = execution_context
# Layer 1: Structured notes — tagged for filtering, streamable via SSE
app.note(f"Reviewing contract #{contract['id']}", ["compliance", "intake"])
result = await app.ai(
system="Review this contract for risk.",
user=str(contract),
schema=ContractReview,
)
# Layer 1 continued: Risk-scored notes for alerting pipelines
if result.risk_score > 0.8:
app.note(
f"HIGH RISK: contract #{contract['id']} score={result.risk_score}",
["alert", "risk", "compliance"],
)
# Layer 2: Correlation IDs propagate automatically across every cross-agent call
# This execution carries: execution_id, workflow_id, session_id, actor_id
# → Every sub-agent call inherits the same workflow_id for end-to-end tracing
app.note(f"Contract #{contract['id']} review complete", ["compliance", "complete"])
return result.model_dump()
# Layers 3-5 require zero application code:
# → GET /api/ui/v1/workflows/{wf_id}/dag — full call graph with depth + timing
# → GET /metrics — Prometheus: queue_depth, step_duration, retries
# → VCs signed by agent DIDs — tamper-evident proof of what happenedWhat you get
- Execution notes -- agents annotate their work with tagged messages for debugging and compliance
- Correlation IDs -- every execution carries
execution_id,workflow_id,session_id, andactor_idfor end-to-end tracing - DAG visualization -- reconstruct the full call graph of multi-agent workflows
- Prometheus metrics -- queue depth, step duration, retry counts, and backpressure at
/metrics - Structured logging -- JSON-formatted logs with correlation context for log aggregation
- Cryptographic audit trails -- combine with Identity and Credentials for tamper-evident records
Execution notes
Agents can attach notes to the current execution for debugging, compliance, and observability:
from agentfield import Agent

app = Agent(node_id="processor", version="1.0.0")

@app.reasoner()
async def process_document(document: str) -> dict:
    app.note("Starting document processing", ["info", "processing"])

    # Analyze
    analysis = await app.ai(
        system="Analyze this document.",
        user=document,
    )
    app.note(f"Analysis complete: {len(analysis)} findings", ["info"])

    # Flag important discoveries
    if "critical" in str(analysis).lower():
        app.note("Critical finding detected", ["alert", "critical"])

    return analysis

app.run()
Notes API
Add a note:
POST /api/v1/executions/note
{
  "message": "Processing complete with 5 findings",
  "tags": ["info", "processing"]
}
The execution ID is resolved from the X-Execution-ID header, the request context, or the execution_id query parameter.
Retrieve notes:
GET /api/v1/executions/{execution_id}/notes
GET /api/v1/executions/{execution_id}/notes?tags=alert,critical
Filter by tags to retrieve specific categories of notes. Tag filtering uses OR logic -- a note matches if it has any of the specified tags.
Response:
{
  "execution_id": "exec_a1b2c3",
  "notes": [
    {
      "message": "Starting document processing",
      "tags": ["info", "processing"],
      "timestamp": "2026-03-23T10:00:01Z"
    },
    {
      "message": "Critical finding detected",
      "tags": ["alert", "critical"],
      "timestamp": "2026-03-23T10:00:08Z"
    }
  ],
  "total": 2
}
Notes are also broadcast via SSE for real-time monitoring -- see the workflow notes stream at GET /api/ui/v1/workflows/{workflowId}/notes/events.
Correlation IDs
Every execution in AgentField carries a set of correlation IDs that enable end-to-end tracing across agents:
| ID | Scope | Description |
|---|---|---|
execution_id | Single call | Unique identifier for one agent function invocation |
workflow_id | Workflow | Groups all executions in a multi-agent workflow; set on the root call and propagated |
run_id | Run | Root workflow scope identifier, generated if not provided; used for SSE event scoping and workflow grouping |
session_id | Session | User-defined session identifier for grouping related workflows |
actor_id | Actor | Identifies the user or system that initiated the workflow |
These IDs are propagated automatically through cross-agent calls. When Agent A calls Agent B, Agent B's execution inherits the workflow_id, session_id, and actor_id from Agent A's context.
Setting Correlation Context
result = await app.call(
    "analyzer.process",
    document=doc,
)
# session_id and actor_id propagate automatically from the execution context
DAG visualization
Multi-agent workflows form a directed acyclic graph (DAG) of executions. The control plane reconstructs this graph for visualization and analysis.
GET /api/ui/v1/workflows/{workflowId}/dag
Response:
{
  "root_workflow_id": "wf_d4e5f6",
  "workflow_status": "succeeded",
  "workflow_name": "document-analysis",
  "session_id": "sess_user_123",
  "actor_id": "user@example.com",
  "total_nodes": 5,
  "max_depth": 3,
  "dag": {
    "workflow_id": "wf_d4e5f6",
    "execution_id": "exec_root",
    "agent_node_id": "orchestrator",
    "reasoner_id": "analyze",
    "status": "succeeded",
    "started_at": "2026-03-23T10:00:00Z",
    "completed_at": "2026-03-23T10:00:30Z",
    "duration_ms": 30000,
    "workflow_depth": 0,
    "notes_count": 3,
    "children": [
      {
        "execution_id": "exec_child_1",
        "agent_node_id": "extractor",
        "status": "succeeded",
        "workflow_depth": 1,
        "parent_execution_id": "exec_root",
        "children": []
      },
      {
        "execution_id": "exec_child_2",
        "agent_node_id": "classifier",
        "status": "succeeded",
        "workflow_depth": 1,
        "parent_execution_id": "exec_root",
        "children": [
          {
            "execution_id": "exec_grandchild",
            "agent_node_id": "sub-classifier",
            "status": "succeeded",
            "workflow_depth": 2,
            "children": []
          }
        ]
      }
    ]
  },
  "timeline": [
    {"execution_id": "exec_root", "started_at": "..."},
    {"execution_id": "exec_child_1", "started_at": "..."},
    {"execution_id": "exec_child_2", "started_at": "..."},
    {"execution_id": "exec_grandchild", "started_at": "..."}
  ]
}
The timeline array provides a flat, chronologically-ordered view of all executions for timeline visualizations.
Prometheus metrics
The control plane exposes Prometheus metrics at /metrics:
| Metric | Type | Description |
|---|---|---|
agentfield_gateway_queue_depth | Gauge | Number of workflow steps currently queued or in-flight |
agentfield_step_duration_seconds | Histogram | Duration of workflow step executions by terminal status |
agentfield_step_retries_total | Counter | Total retry attempts by agent node |
agentfield_waiters_inflight | Gauge | Number of synchronous waiter channels currently registered |
agentfield_gateway_backpressure_total | Counter | Backpressure events by reason |
Scrape Configuration
# prometheus.yml
scrape_configs:
  - job_name: agentfield
    static_configs:
      - targets: ['localhost:8080']
    metrics_path: /metrics
    scrape_interval: 15s
Structured logging
The control plane uses zerolog for structured JSON logging. Every log entry includes correlation context:
{
  "level": "info",
  "execution_id": "exec_a1b2c3",
  "workflow_id": "wf_d4e5f6",
  "agent_node_id": "processor",
  "message": "execution completed",
  "duration_ms": 14200,
  "status": "succeeded",
  "time": "2026-03-23T10:00:15Z"
}
This format integrates directly with log aggregation systems like ELK, Loki, or CloudWatch.
Combining audit layers
AgentField's audit system is most powerful when all layers are used together:
                    Observability Stack
                         ^
                         |
    Prometheus <-- /metrics (queue depth, latency, retries)
                         |
    Log Aggregator <-- Structured JSON logs (execution context)
                         |
    Webhook Forwarder <-- All events (SSE, execution, node)
                         |
    +-------------------------------------------------+
    |              AgentField Control Plane             |
    |                                                   |
    |  Execution Notes -- human-readable audit trail    |
    |  Correlation IDs -- end-to-end tracing            |
    |  DAG Visualization -- workflow call graph          |
    |  DIDs -- cryptographic agent identity              |
    |  VCs -- tamper-evident execution proofs            |
    +-------------------------------------------------+
| Layer | Purpose | Reference |
|---|---|---|
| Notes | Human-readable annotations | This page |
| Correlation IDs | End-to-end tracing | This page |
| DAG | Workflow structure | This page |
| Metrics | System health | This page |
| DIDs | Agent identity | Identity |
| VCs | Cryptographic proofs | Credentials |
| Webhooks | Event forwarding | Webhooks |
Patterns
Compliance Audit Trail
For regulated workflows, combine notes with VCs:
@app.reasoner()
async def regulated_analysis(document: str) -> dict:
    app.note("Received document for regulated analysis", ["compliance", "intake"])

    # Process with audit annotations
    analysis = await app.ai(system="...", user=document)
    app.note(f"AI analysis completed", ["compliance", "processing"])

    # Human review
    result = await app.pause(
        approval_request_id="compliance_review",
        approval_request_url="https://review.example.com/...",
    )
    app.note(f"Human decision: {result.decision}", ["compliance", "approval"])

    return {"analysis": analysis, "approval": result.decision}

    # After execution:
    # - Notes provide a human-readable timeline
    # - VC provides cryptographic proof of what happened
    # - DAG shows the full workflow structure
    # - All are queryable via API
Real-Time Monitoring Dashboard
Stream execution events and notes for a live dashboard:
// SSE client for real-time execution events
const events = new EventSource('/api/ui/v1/executions/events');

events.addEventListener('execution.completed', (e) => {
  const data = JSON.parse(e.data);
  updateDashboard(data);
});

events.addEventListener('workflow_note_added', (e) => {
  const data = JSON.parse(e.data);
  appendNote(data.note);
});