Workflow tracing
Distributed tracing headers, DAG visualization, and real-time SSE streaming for multi-agent workflows.
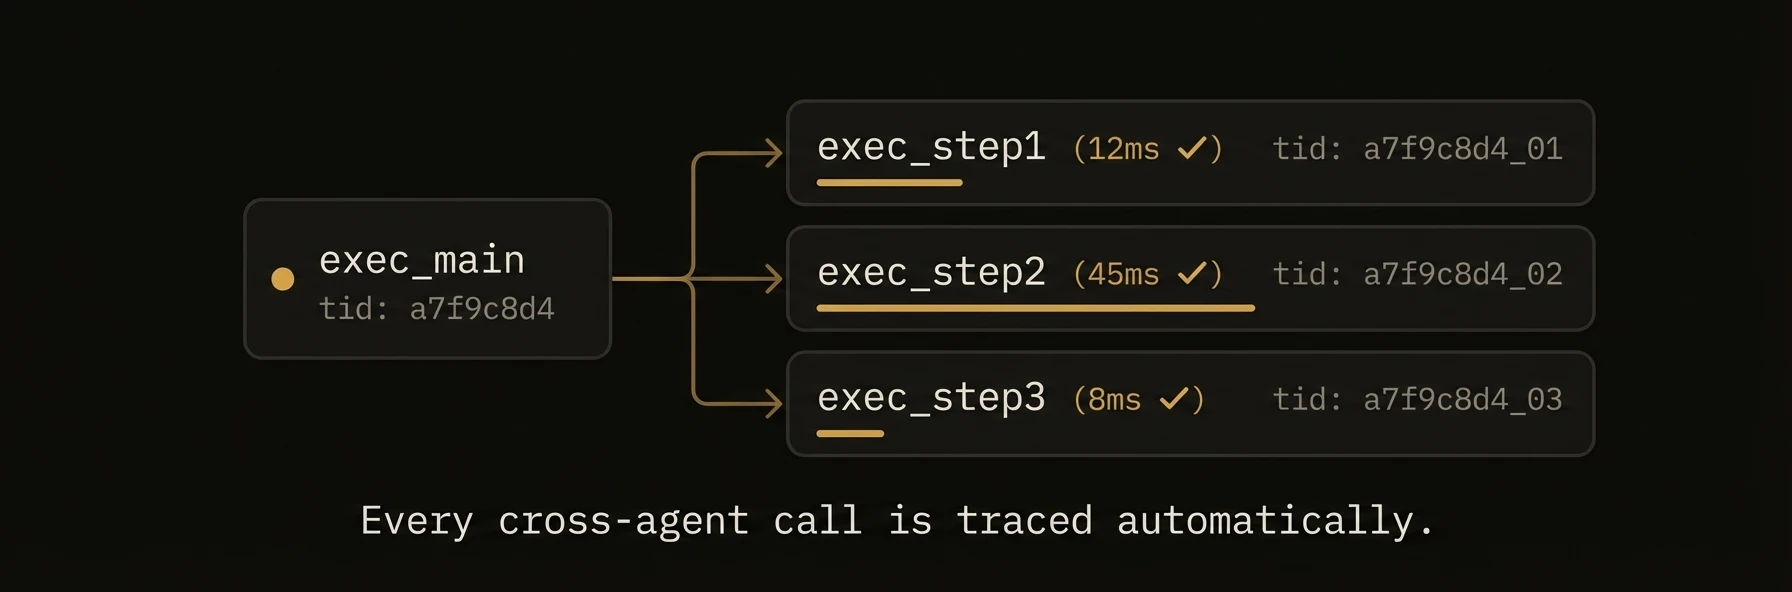
See every agent call, every dependency, every millisecond -- across your entire multi-agent workflow.
When Agent A calls Agent B which calls Agent C, you need to understand the full execution graph: what ran, in what order, how long each step took, and where failures occurred. AgentField propagates tracing headers on every cross-agent call, builds a DAG of the execution graph, and streams events in real-time via SSE.
Want to hand this graph to someone?
af share <run-id>exports the whole DAG as a self-contained HTML file, andaf share <run-id> --publicpublishes a permalink. Seeaf sharein the CLI reference, or open a shared run to see the output.
from agentfield import Agent

app = Agent(node_id="orchestrator")

@app.reasoner()
async def analyze_portfolio(portfolio: dict) -> dict:
    # Each call propagates tracing headers automatically
    # The control plane builds a DAG from the execution tree
    risk = await app.call("risk-analyzer.assess", input=portfolio)
    compliance = await app.call("compliance-checker.verify", input=portfolio)
    allocation = await app.call("allocation-optimizer.optimize", input={
        "portfolio": portfolio,
        "risk": risk,
        "compliance": compliance,
    })
    return {"risk": risk, "compliance": compliance, "allocation": allocation}

# After execution, query the workflow DAG via the REST API
# GET /api/ui/v1/workflows/{workflowId}/dag
import httpx

async def inspect_workflow(workflow_id: str):
    async with httpx.AsyncClient() as client:
        resp = await client.get(f"http://localhost:8080/api/ui/v1/workflows/{workflow_id}/dag")
        dag = resp.json()

    # The response is a nested tree rooted at dag["dag"] with children
    def walk(node, indent=0):
        print(f"{'  ' * indent}{node['agent_node_id']}.{node['reasoner_id']}: {node['status']} ({node.get('duration_ms', '...')}ms)")
        for child in node.get("children", []):
            walk(child, indent + 1)
    walk(dag["dag"])
What just happened
- Every cross-agent call carried tracing context automatically
- The control plane reconstructed the workflow as a queryable DAG
- Real-time events exposed execution start, completion, and depth without extra instrumentation
Example trace context:
{
  "workflow_id": "wf_abc123",
  "execution_id": "exec_2",
  "parent_execution_id": "exec_1",
  "caller_node_id": "orchestrator",
  "depth": 1
}
What you get
- Automatic header propagation -- tracing headers flow through every cross-agent call without any code changes.
- Execution DAG -- query the full dependency graph of any workflow via REST API.
- Real-time SSE -- stream execution events as they happen for dashboards and monitoring.
- Correlation IDs -- trace a user request across dozens of agent calls with a single ID.
- OpenTelemetry compatible -- headers map to W3C trace context for export to Jaeger, Zipkin, or Datadog.
- Depth tracking -- know exactly how deep in the call chain each execution sits.
- Session ingress traced -- realtime sessions emit the same DAG. Tool calls from the live model carry
X-Session-IDintoexecute/async; query withaf session workflows <session_id>.
Tracing headers
These headers are propagated automatically on every cross-agent call via the control plane.
| Header | Type | Description |
|---|---|---|
X-Run-ID | string | Unique ID for the entire top-level invocation |
X-Workflow-ID | string | Identifies the workflow this execution belongs to |
X-Execution-ID | string | Unique ID for this specific execution |
X-Parent-Execution-ID | string | Execution ID of the caller (empty for root) |
X-Session-ID | string | Carries the session context across agents |
X-Actor-ID | string | Carries the actor/user identity across agents |
X-Caller-DID | string | Decentralized identifier of the calling agent |
X-Agent-Node-ID | string | node_id of the current agent |
X-Agent-Node-DID | string | Decentralized identifier (DID) of the current agent node |
Accessing Headers in Agent Code
@app.reasoner()
async def my_handler(input: dict, execution_context=None) -> dict:
    # execution_context is injected automatically when declared as a parameter
    print(execution_context.run_id)              # "run_1711234567890_abc12345"
    print(execution_context.execution_id)        # "exec_1711234567890_def67890"
    print(execution_context.parent_execution_id) # "exec_1711234567890_aaa11111"
    print(execution_context.workflow_id)         # "run_1711234567890_abc12345"
    print(execution_context.session_id)          # "session-123"
    print(execution_context.actor_id)            # "user-456"
    print(execution_context.depth)               # 1

    return {"traced": True}
DAG visualization API
Query the execution graph for any workflow to understand call patterns, bottlenecks, and failures.
Get Workflow DAG
GET /api/ui/v1/workflows/{workflowId}/dag
Response:
{
  "root_workflow_id": "wf_abc123",
  "workflow_status": "succeeded",
  "workflow_name": "analyze_portfolio",
  "total_nodes": 2,
  "max_depth": 1,
  "dag": {
    "workflow_id": "wf_abc123",
    "execution_id": "exec_1",
    "agent_node_id": "orchestrator",
    "reasoner_id": "analyze_portfolio",
    "status": "succeeded",
    "started_at": "2026-03-24T10:00:00Z",
    "completed_at": "2026-03-24T10:00:14Z",
    "duration_ms": 14200,
    "workflow_depth": 0,
    "children": [
      {
        "workflow_id": "wf_abc123",
        "execution_id": "exec_2",
        "agent_node_id": "risk-analyzer",
        "reasoner_id": "assess",
        "status": "succeeded",
        "started_at": "2026-03-24T10:00:01Z",
        "completed_at": "2026-03-24T10:00:04Z",
        "duration_ms": 3200,
        "parent_execution_id": "exec_1",
        "workflow_depth": 1,
        "children": []
      }
    ]
  },
  "timeline": []
}
The response uses a nested tree structure -- parent-child relationships are expressed via children arrays and parent_execution_id fields rather than a separate edges array.
Get Execution Details
GET /api/v1/executions/{execution_id}
Returns full execution details including input, output, trace context, and timing.
SSE event streaming
Stream execution events in real-time for dashboards, monitoring, and debugging.
Execution Events
GET /api/ui/v1/executions/events
The handler currently streams all execution events from the event bus without server-side filtering. Query parameters such as workflow_id or agent_id are not yet implemented -- filter on the client side for now.
Event Format
Events are sent as plain data: frames without an event: field name. Each frame contains a JSON object with a type field indicating the event kind. Periodic heartbeat events are sent every 30 seconds to keep the connection alive.
data: {"type":"execution.started","execution_id":"exec_1","workflow_id":"wf_abc123","agent_node_id":"orchestrator"}

data: {"type":"heartbeat","timestamp":"2026-03-24T10:00:30Z"}
Consuming SSE in Code
import httpx
import json

async def stream_events():
    # Note: server-side filtering is not yet implemented; filter client-side.
    url = "http://localhost:8080/api/ui/v1/executions/events"
    async with httpx.AsyncClient() as client:
        async with client.stream("GET", url) as response:
            async for line in response.aiter_lines():
                if line.startswith("data:"):
                    event = json.loads(line[5:])
                    if event.get("type") == "heartbeat":
                        continue
                    print(f"[{event.get('agent_node_id', 'system')}] {event.get('type')} ({event.get('duration_ms', '...')}ms)")
Correlation ID patterns
Correlation IDs let you trace a single user request across every agent call in the system.
User-Supplied Correlation ID
Correlation IDs are propagated through the execution context headers (X-Run-ID serves as the correlation identifier). The run ID is auto-generated at the root call and forwarded through every child call automatically.
When calling from an external system (e.g., API gateway), include the header on the initial HTTP request:
curl -X POST http://localhost:8080/api/v1/execute/orchestrator.analyze \
  -H "X-Run-ID: req_abc_from_frontend" \
  -H "Content-Type: application/json" \
  -d '{"input": {"portfolio_id": "p-123"}}'
Querying by Correlation ID
# Retrieve the workflow DAG for a given run ID
curl "http://localhost:8080/api/ui/v1/workflows/req_abc_from_frontend/dag" | jq .

# Filter SSE events by workflow
curl -N "http://localhost:8080/api/ui/v1/executions/events?workflow_id=req_abc_from_frontend"
OpenTelemetry Export
AgentField headers map to W3C Trace Context for export to standard tracing backends:
| AgentField Header | W3C Equivalent | OpenTelemetry Field |
|---|---|---|
X-Workflow-ID | -- | service.workflow_id (attribute) |
X-Execution-ID | traceparent span | span_id |
X-Run-ID | traceparent trace | trace_id |
OpenTelemetry tracing export is configured through environment variables or configuration files, not via API. Refer to the OpenTelemetry SDK configuration for available options such as OTEL_EXPORTER_OTLP_ENDPOINT and OTEL_SERVICE_NAME.
Patterns
Performance Bottleneck Detection
Use the DAG API to find slow agents in a workflow.
async def find_bottlenecks(workflow_id: str, threshold_ms: int = 5000):
    async with httpx.AsyncClient() as client:
        resp = await client.get(f"http://localhost:8080/api/ui/v1/workflows/{workflow_id}/dag")
        dag = resp.json()

    # Flatten the nested DAG tree into a list
    nodes = []
    def collect(node):
        nodes.append(node)
        for child in node.get("children", []):
            collect(child)
    collect(dag["dag"])

    bottlenecks = [n for n in nodes if (n.get("duration_ms") or 0) > threshold_ms]

    for node in sorted(bottlenecks, key=lambda n: n.get("duration_ms", 0), reverse=True):
        print(f"SLOW: {node['agent_node_id']}.{node['reasoner_id']} — {node['duration_ms']}ms")
Failure Root Cause Analysis
Walk the DAG to find the original failure in a cascade.
async def find_root_failure(workflow_id: str):
    async with httpx.AsyncClient() as client:
        resp = await client.get(f"http://localhost:8080/api/ui/v1/workflows/{workflow_id}/dag")
        dag = resp.json()

        # Flatten the nested DAG tree
        nodes = []
        def collect(node):
            nodes.append(node)
            for child in node.get("children", []):
                collect(child)
        collect(dag["dag"])

        failed = [n for n in nodes if n["status"] == "failed"]
        # Sort by depth (deepest = most likely root cause)
        failed.sort(key=lambda n: n["workflow_depth"], reverse=True)

        if failed:
            root = failed[0]
            print(f"Root cause: {root['agent_node_id']} at depth {root['workflow_depth']}")
            resp = await client.get(f"http://localhost:8080/api/v1/executions/{root['execution_id']}")
            exec_detail = resp.json()
            print(f"Error: {exec_detail.get('error', 'unknown')}")